An Ops Checklist

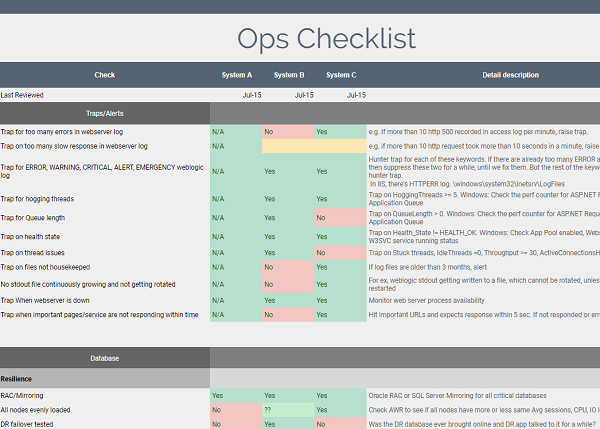
A couple of years back, I spent two months reading through over two thousand outage incidents from our incident database: what caused it, how people identified the root cause, what did they do to prevent it from happening. It was more interesting than reading Sherlock Holmes stories. These were real-life incidents, real lessons learned, and real actions taken.

From that study, I have compiled a checklist. I find it quite useful, as it:

  1.  Provides a holistic checklist to quickly build situational awareness.
  2. Shows a side-by-side comparison of health of multiple systems.
  3. Identifies which systems need significant investment in operational improvement.
  4. Identifies which systems are well ahead of others and can share their lessons with others.

Hope this helps others. Feel free to comment and suggest more items.

Here’s the Google Sheet: http://bit.ly/opschklst

Enjoy!


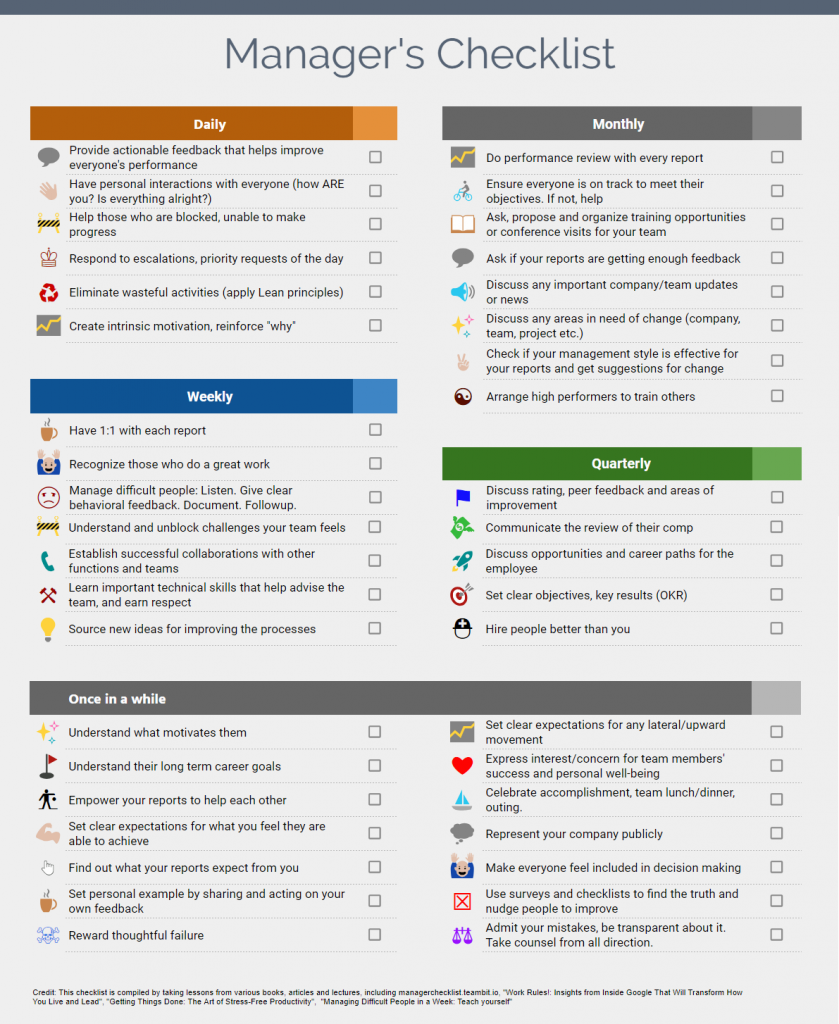
A Manager’s Checklist

Managing people is hard. Many books have been written, lectures given, articles written on how to manage people effectively. Remembering all those good lessons while working under pressure is difficult. Things tend to slip here and there. Sparks flare. Faces get grumpier. People quit… This checklist should help keep things in order.

I have compiled this list from various resources that I have come across over the years. Hope it helps other managers out there. Credit goes to those amazing authors and speakers whose ideas have changed my life, and gave birth to this checklist. I am just a compiler.

Google sheet: http://bit.ly/mgrchklst

Download PDF for print: ManagerChecklist

Any feedback welcome!

Defend ASP.NET and WCF from various attacks using Nginx

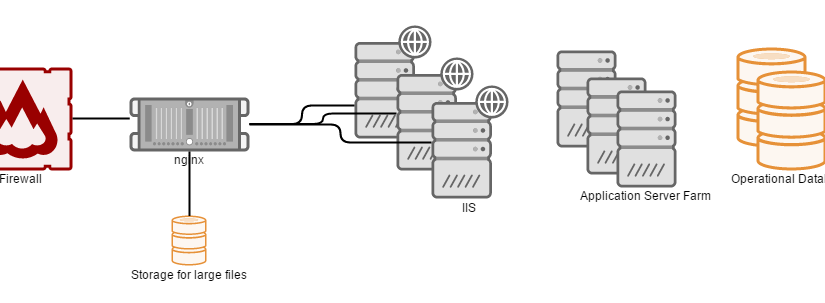
ASP.NET websites and WCF services can be attacked in many ways to slow down the service and even cause a complete outage. One can perform slowloirs attack to exhaust all connections and threads on IIS and cause a complete outage. One can hit expensive URLs like Download URLs or exploit an expensive WCF service to cause high CPU usage and bring down the service. One can open too many parallel connections and stop IIS from accepting more connections. One can exploit a large file download URL and perform continuous parallel download and exhaust the network bandwidth, causing a complete outage or expensive bandwidth bill at the end of the month. One can also find a way to insert a large amount of data in the database and exhaust database storage.

Thus ASP.NET and WCF services, like all other web technology platforms, need more than standard network firewall. They need proper Web Application Firewall (WAF), which can inspect exactly what is being done on the application and block malicious transactions, specific to the application being protected. Nginx (engine x) is such an application that can offer many types of defence for ASP.NET and WCF and it can significantly speed up an ASP.NET website by offloading static files and large file transfers.

Even if you have zero knowledge of Linux, you can still get a decent nginx setup done.

deployment

Read details from this CodeProject article:

http://www.codeproject.com/Articles/1115111/Defend-ASP-NET-and-WCF-from-various-attacks-using

Don’t forget to vote!

HackerSpray – Block Brute force and DOS attacks

HackerSprayLogoHackerSpray is a .NET library to defend websites and web APIs against brute force and Denial-of-Service attacks. It comes as .NET 4 and .NET Core library. You can use it to protect ASP.NET Webforms, MVC, WebAPI anything that runs on a webserver. You can also use it in a non-web application context, for instance a chat server, where you want to prevent too many executions of certain transactions or you want to block hits from certain IPs.

github.com/oazabir/HackerSpray

Features:
  • Protect login, registration, password reset pages againstbrute force and DOS attacks.
  • Block users from performing any action too many times.
  • Prevent too many hits from any IP or IP Range.
  • Blacklist/Whitelist specific IP, IP range, username, URLs, transactions for a period.

An example scenario is a Bank Login page, where brute force password attempts on user accounts and DOS attack on Login page are a regular event. Using this library, you can protect login page from brute force attacks, blocking too many usernames from certain IPs, or too many hits from a range of IP trying to do DOS attack, or even simple 3 invalid login attempts per username, per 15 mins, across all webservers.

This high performance, lightweight library protects you from hitting the database too many times on pages or APIs that are target for attacks, thus lowering web server and database CPU, increasing the scalability of the overall application.

Powerful IIS/Apache Monitoring dashboard using ElasticSearch+Grafana

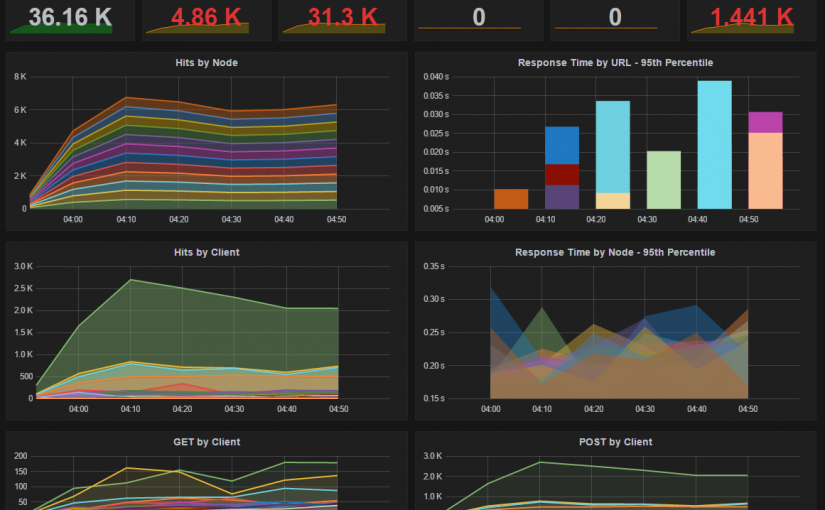
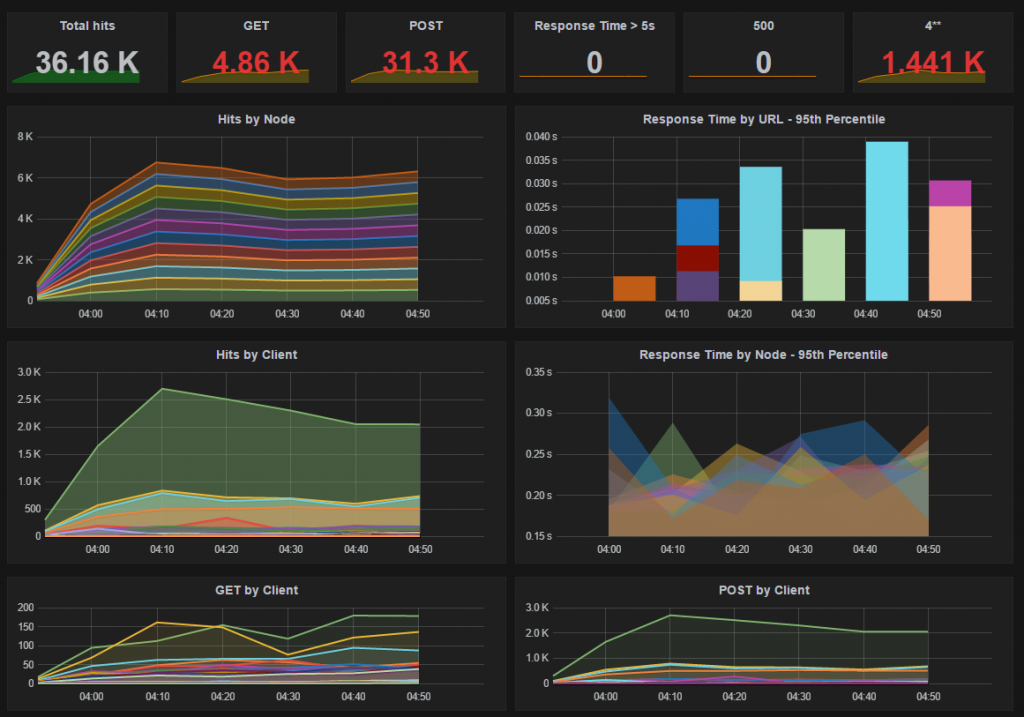
IIS or Apache do not come with any monitoring dashboard that shows you graphs of requests/sec, response times, slow URLs, failed requests and so on. You need to use external tools to visualize that. ElasticSearch and Grafana are two such tools that let you collect logs from web servers, and then parse, filter, sort, analyze, and create beautiful presentations out of them. ElasticSearch is a distributed JSON document store, just like a NoSQL database. You can use it to store logs as JSON documents. Then you can use Grafana to fetch those documents from ElasticSearch and build beautiful presentations. Both are free and open source. 

Web Graph

Read the full details here, please don’t forget to rate:

http://www.codeproject.com/Articles/1094405/Powerful-IIS-Apache-Monitoring-dashboard-using

ElasticSearch is a very powerful product. It is a multi-purpose distributed JSON document store and also a powerful search engine. Most frequent use cases for ElasticSearch is to create searchable documents, implement auto completion feature, and also aggregate logs and analyze them. Grafana is a beautiful Dashboard tool that takes ElasticSearch, among many, as a data source. Combing these two, you can build sophisticated monitoring and reporting tools to get a holistic view on how your application is performing and where the issues are.

Enjoy!

jChaart – Web Dashboard Framework

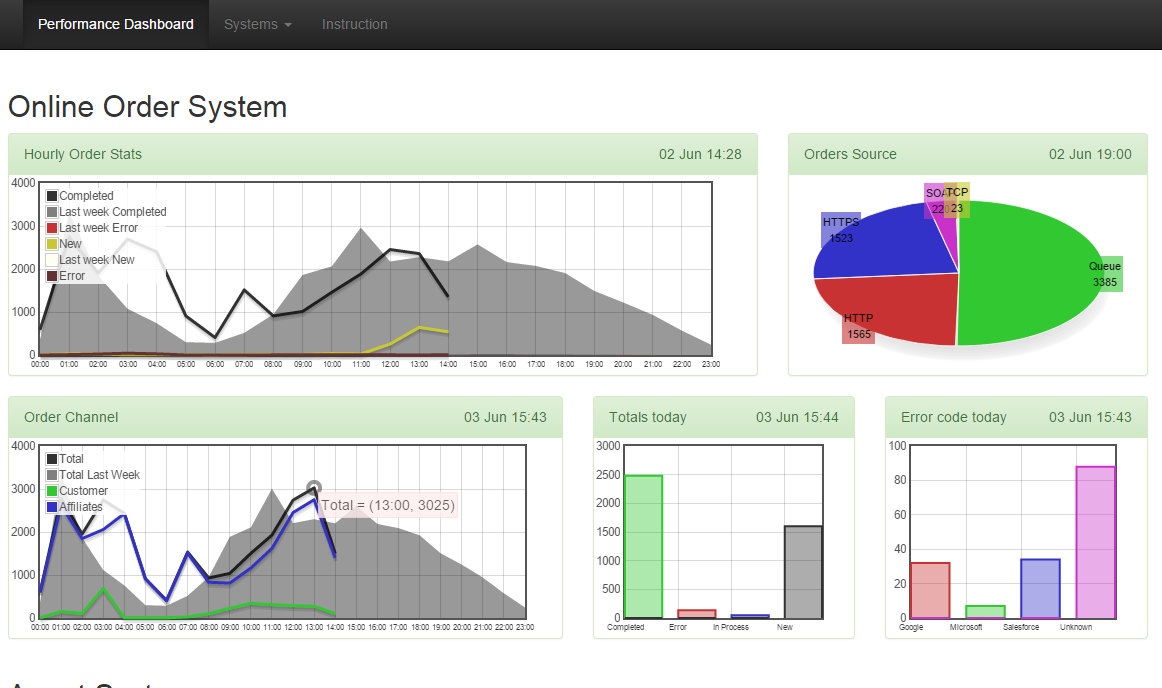
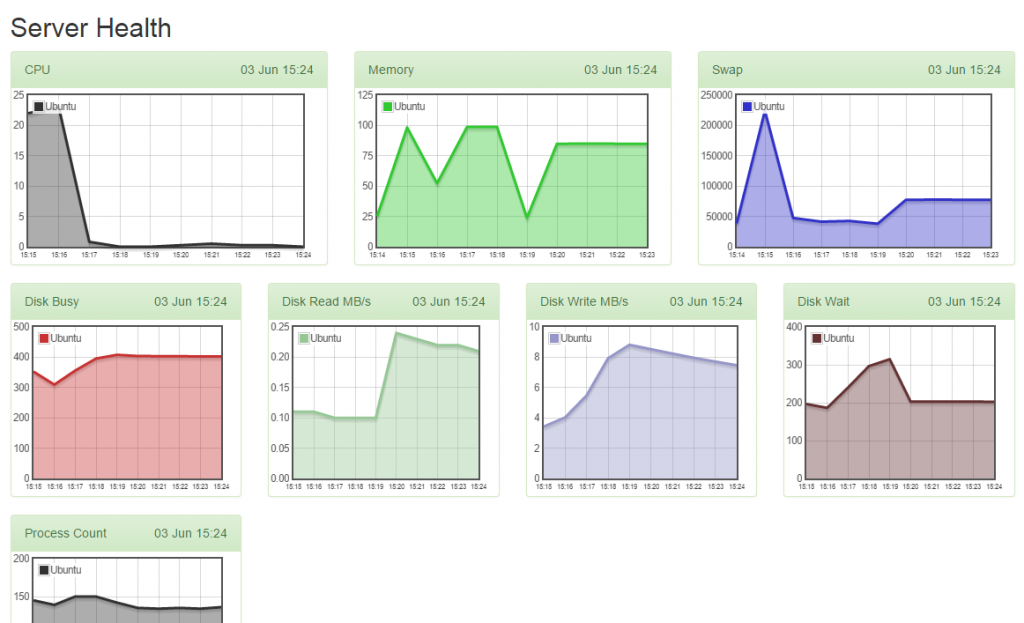
A Javascript-only, web based Dashboard library, that you can use to make eye-catchy Charts showing Transactions stats for your application, Server CPU, Memory, IO graphs etc. It offers libraries to convert different types of delimited text files into Charts. Those delimited files are generated from various sources, eg running SQL queries against a Database, or running shell scripts to collect system stats, or Powershell scripts to process IIS logs. End result is a nice-looking Twitter Bootstrap powered, responsive Web Dashboard, that you can get up and running in no time, on any platform. Since it is HTML and Javascript, you can customize it to show exactly what you want, how you want. Quite handy for earning brownie points and wooing your customers.

Here’s an example how a Transaction Dashboard may look like:


Screenshot


And an example of a System Monitoring dashboard:

ServerHealth

The GitHub project is here:

https://github.com/oazabir/jChaart

You are welcome to join and participate.

Build, deploy, anonymize config, zip package, git commit, push from a single command

gitautomateWhile working on open source projects, you have to frequently build your code, clean up all temporary files, remove your own passwords, connections strings from web.config, then create a binary deployment package in a zip format and then commit and git push to GitHub. Let’s automate all these using a configurable powershell script.

Here’s the full script.

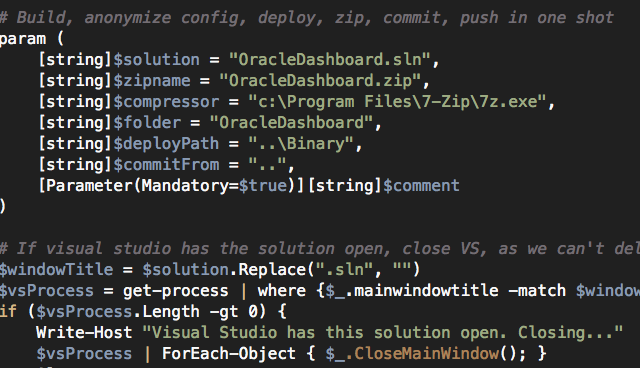
First step, let’s define the parameters for the script with some default values:

param (
    [string]$solution = "OracleDashboard.sln",
    [string]$zipname = "OracleDashboard.zip",
    [string]$compressor = "c:\Program Files\7-Zip\7z.exe",
    [string]$folder = "OracleDashboard",
    [string]$deployPath = "..\Binary",
    [string]$commitFrom = "..",
    [Parameter(Mandatory=$true)][string]$comment
)

Some description of these parameters:

  • $solution = path of the solution file relative to the script location
  • $zipname = name of the zip file.
  • $compressor = 7-zip’s 7z.exe file path.
  • $folder = the folder that contains the code, which is zipped.
  • $deployPath = relative path where the zip file will be moved to.
  • $commitFrom = relative path where the script will run git commit and git push from.
  • $comment = A comment for the git commit.

The first thing the script does is look for the solution open in Visual Studio and close it. You can comment this section out if you want. But if Visual Studio is open, then /obj folder cannot be deleted.

# If visual studio has the solution open, close VS, as we can't delete obj folder while it is open
$windowTitle = $solution.Replace(".sln", "")
$vsProcess = get-process | where {$_.mainwindowtitle -match $windowTitle -and $_.ProcessName -eq "devenv"} 
if ($vsProcess.Length -gt 0) {
    Write-Host "Visual Studio has this solution open. Closing..."
    $vsProcess | ForEach-Object { $_.CloseMainWindow(); }
    Sleep 5
    Read-Host "Press ENTER to proceed if Visual Studio is closed"
    $vsProcess = get-process | where {$_.mainwindowtitle -match $windowTitle -and $_.ProcessName -eq "devenv"} 
    if ($vsProcess.Length -gt 0) {
        Write-Host "Visual Studio still has the solution open. Aborting."
        Return
    }
}

Next step is to do some spring cleaning:

Push-Location

if (Test-Path $zipname) { rm $zipname; }

# Clean up deploy folder 
rm $deployPath\*.* -Force -Recurse

First remember the current path. We have to come back to this path after we are done. Then remove the zip file if it already exists. Then cleanup the $deployPath. You can remove this if you want to keep old deployment packages. Then you have to handle generation of unique file names for the packages.

Now, let’s build and remove /obj folder:

# Build new version
msbuild /verbosity:minimal $solution

# Delete obj
if (Test-Path $folder\obj) { rm $folder\obj -Force -Recurse }

Next step: remove all sensitive information from the web.config, which includes connection strings, authorization block, appSettings entries etc. This is all up to you to customize:

# backup the web.config and remove sensitive entries before pushing to git, eg connectionString
[string]$filename = gi $folder\web.config 
[string]$backup = [System.IO.File]::ReadAllText($filename)
$xml =

[xml][/xml]

$backup $xml.PreserveWhitespace = $true foreach($n in $xml.configuration.connectionStrings.add) { $n.ParentNode.RemoveChild($n); } # Anonymize any sensitive appSettings entry foreach($n in $xml.configuration.appSettings.add) { switch($n.key) { "Password" { $n.value = "Password" } } } # Remove authorization blocks $xml.configuration.'system.web'.authorization.RemoveAll() $xml.Save($filename)

Finally, let’s run some regular expression check to ensure the web.config does not have any sensitive information left accidentally. Again, this is all up to you to customize.

# verify if web.config still contains any sensitive info
[string]$config = gc $folder\web.config
if ( ($config -match 'connectionString="\w+') -or ($config -match 'users="\w+') ) {
    Write-Host "Configuration file is not cleaned."
    # Restore web.config
    [System.IO.File]::WriteAllText($filename, $backup)
    Exit
}

Now time to compress the source folder and create a zip file using 7-zip.

# Compress the solution folder and copy to deploy folder
cmd /c $compressor a -tzip $zipname $folder -r 
cmd /c copy $zipname $deployPath /Y
cmd /c del $zipname

Finally git commit and push:

# Commit and push to GitHub
cd $commitFrom
git pull
git add -A *.*
git commit -a -m $comment
git push 
Pop-Location

And last step is to restore your own web.config, that was anonymized:

# Restore web.config
[System.IO.File]::WriteAllText($filename, $backup)

That’s it. Now all you have to do is, just hit ./gitpush.ps1 from Powershell command line and you are done!
Real-time Oracle Database Monitoring Dashboard in ASP.NET

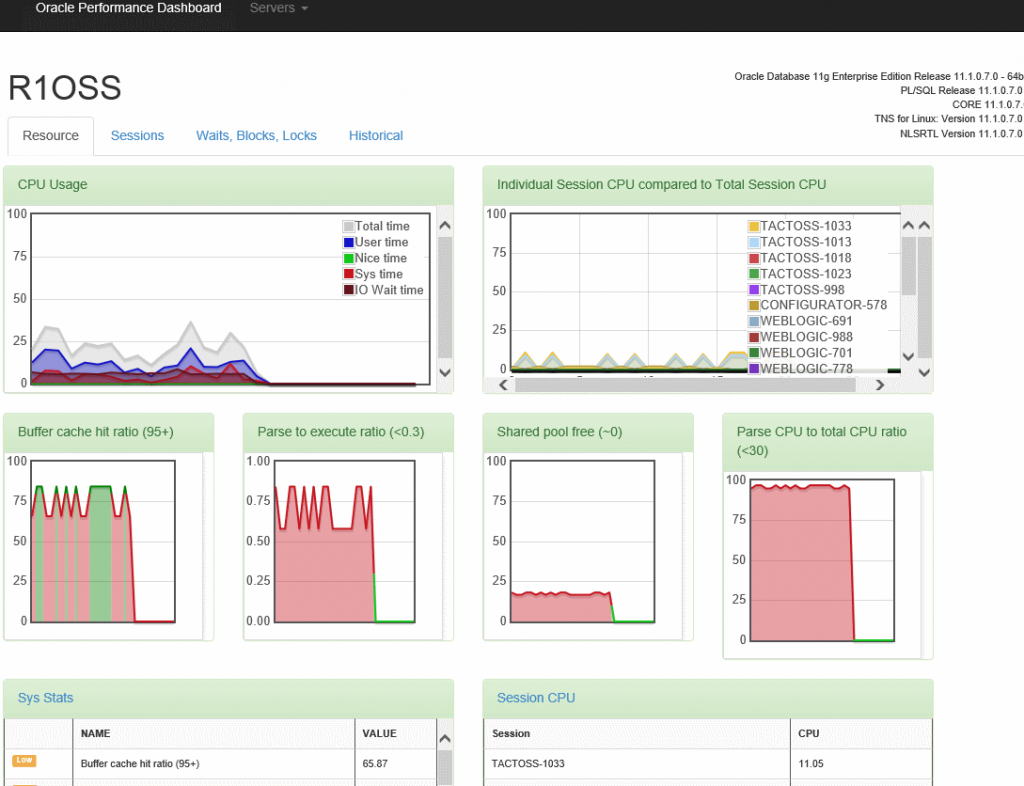
Oracle Performance Dashboard (OPD) is a small ASP.NET website that shows you performance & problems of one or more Oracle instances in near real-time. It uses the Dynamic Performance Views (DPV) and runs some popular DBA scripts in order to get meaningful, easy to understand information out of the server. You can use it to quickly spot blocking queries, who is blocking who, expensive query that are consuming high CPU or disk, see if there’s unusual locks, very high disk activity and so on.

Dashboard - Full

Demo

You can see a live demo of this from here:
http://odp.omaralzabir.com

Get the code

The binaries are here, which you can just extract into an IIS folder, put the connection strings in the web.config file, and you are ready to roll. No need to install any Oracle client software on the server.
GitHub Project Binaries

You can get the source code from the GitHub project site:
https://github.com/oazabir/OraclePerformanceDashboard

Feature walkthrough

OPD comes with the following features in V1:

  • Summary of all your instances in one screen, showing important indicators on each instance. Quick way to check if all your databases are doing fine or not.
  • Instance Dashboard showing details of an instance:
    • CPU usage on the OS.
    • CPU consumed by each session
    • Important System Statistics like Buffer Gets, Parse to execute ratio which would indicate some common problems on the server.
    • Sessions and what the sessions are doing, how much resource they are consuming, whether they are hogging the disk or not.
    • Waits, Blocks, Locks, deadlocks that make database suffer.
    • Historical analysis on the databse showing you some very useful stuff:
      • Most expensive queries in terms of CPU and Buffer Get, which are immediate convern for your devs to sort out.
      • IO usage on data files. You can see if some data file is unusually loaded and getting hammered by physical IO.
      • Tablespace usage. Alerts you if some tablespace is over 85% full.
      • Stale stats on tables. You should always keep this clean.
      • Killer Indexes that will actually blow up your system and confuse Oracle query optimizer. You need to get rid of those indexes and rewrite queries that you thought will hit those indexes for better performance. They won’t. They will kill your database.

Web-based real-time SQL Server Performance Dashboard

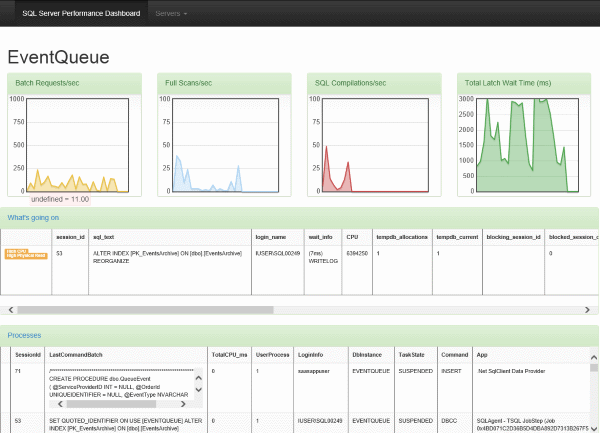
SQL Server Performance Dashboard (SSPD) is a small open source web app that shows you performance & problems of one or more SQL Server instances and their databases in near real time. It uses the Dynamic Management Views (DMV) to gather useful data from the verbose output and combines them with utility stored procs in order to get meaningful, easy to understand information out of them. You can use it to quickly spot blocking queries, who is blocking who, expensive query that are consuming high CPU or disk, see if there’s unusual locks, very high disk activity and so on.

See a live demo: http://dashboard.omaralzabir.com/

You can read details about the tool from this CodeProject article: http://www.codeproject.com/Articles/799053/Web-based-real-time-SQL-Server-Performance-Dashboa

The binaries are here, which you can just extract into a IIS folder, put the connection strings in the web.config file and you are ready to roll:

SqlServerPerformanceDashboard GitHub Project Binaries

Or you can get the source code from the GitHub project site: https://github.com/oazabir/SQLServerDashboard