A Javascript-only, web based Dashboard library, that you can use to make eye-catchy Charts showing Transactions stats for your application, Server CPU, Memory, IO graphs etc. It offers libraries to convert different types of delimited text files into Charts. Those delimited files are generated from various sources, eg running SQL queries against a Database, or running shell scripts to collect system stats, or Powershell scripts to process IIS logs. End result is a nice-looking Twitter Bootstrap powered, responsive Web Dashboard, that you can get up and running in no time, on any platform. Since it is HTML and Javascript, you can customize it to show exactly what you want, how you want. Quite handy for earning brownie points and wooing your customers.
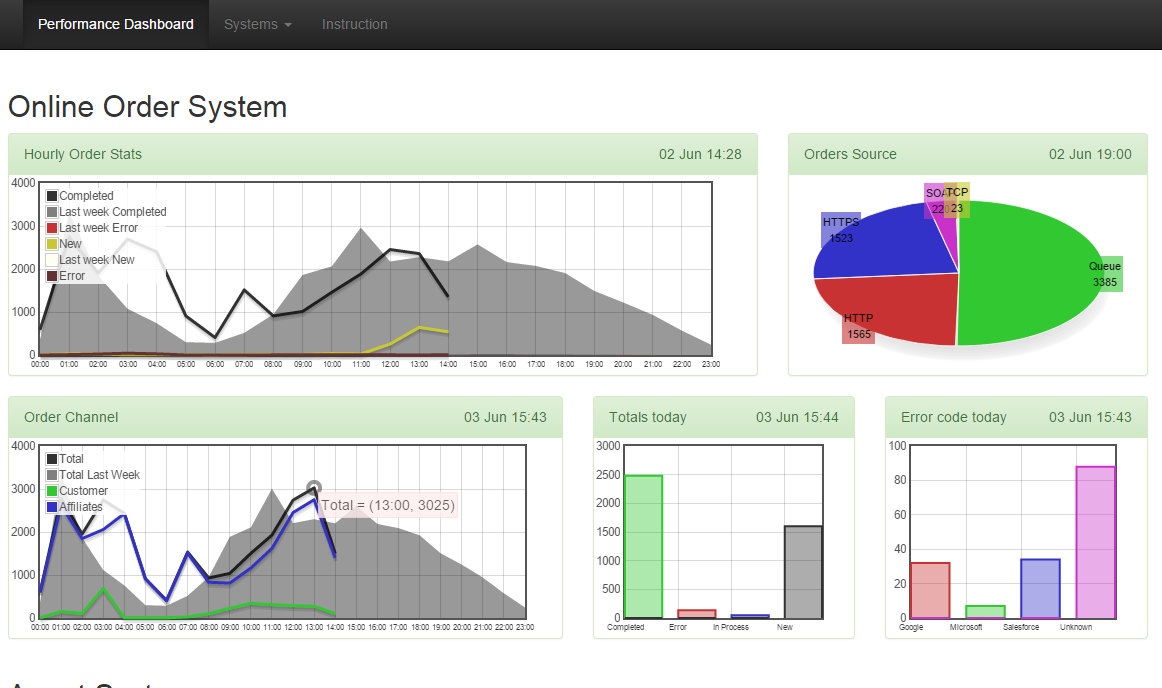
Here’s an example how a Transaction Dashboard may look like:

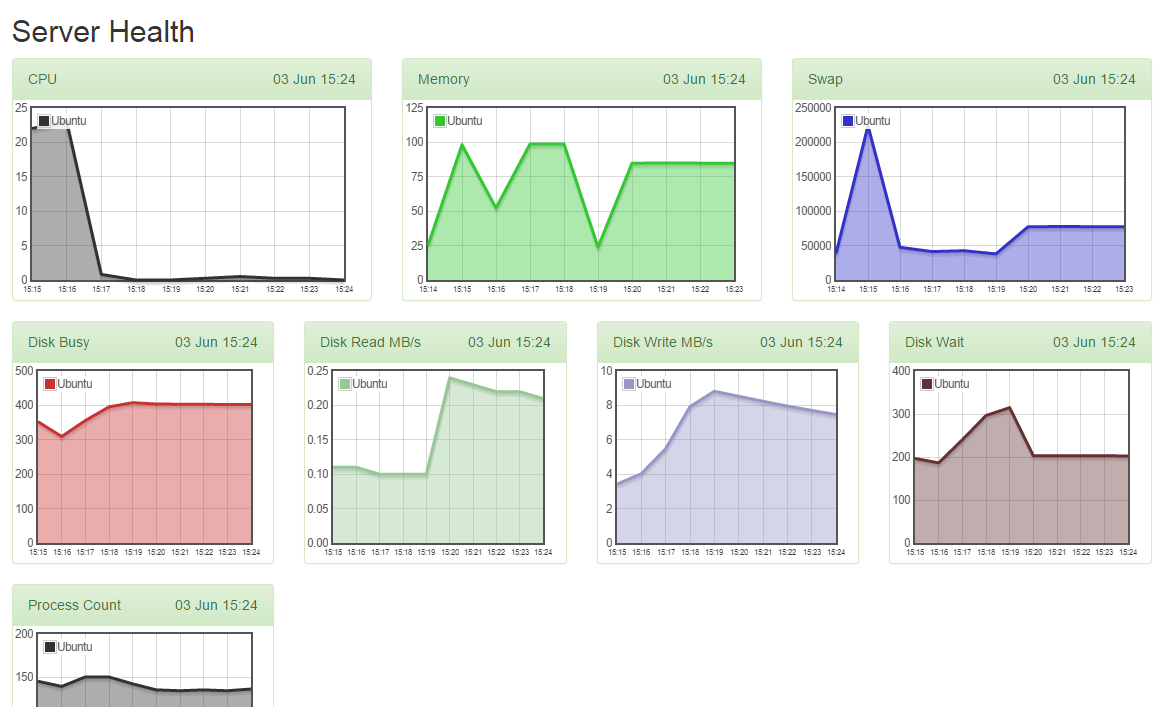
And an example of a System Monitoring dashboard:
The GitHub project is here:
https://github.com/oazabir/jChaart
You are welcome to join and participate.