Keep website and webservices warm with zero coding

If you want to keep your websites or webservices warm and save user from seeing the long warm up time after an application pool recycle, or IIS restart or new code deployment or even windows restart, you can use the tinyget command line tool, that comes with IIS Resource Kit, to hit the site and services and keep them warm. Here’s how:

First get tinyget from here. Download and install the IIS 6.0 Resource Kit on some PC. Then copy the tinyget.exe from “C:Program Files (x86)IIS ResourcesTinyGet” to the server where your IIS 6.0 or IIS 7 is running.

Then create a batch file that will hit the pages and webservices. Something like this:

SET TINYGET=C:Program Files (x86)IIS ResourcesTinyGettinyget.exe

"%TINYGET%" -srv:dropthings.omaralzabir.com -uri:http://dropthings.omaralzabir.com/ -status:200
"%TINYGET%" -srv:dropthings.omaralzabir.com -uri:http://dropthings.omaralzabir.com/WidgetService.asmx?WSDL - status:200

Save this in a batch file and run it as a scheduled task at some interval like 10 minutes and your website will always remain nice and warm.

First I am hitting the homepage to keep the webpage warm. Then I am hitting the webservice URL with ?WSDL parameter, which allows ASP.NET to compile the service if not already compiled and walk through all the operations and reflect on them and thus loading all related DLLs into memory and reducing the warmup time when hit.

Tinyget gets the servers name or IP in the –srv parameter and then the actual URI in the –uri. I have specified what’s the HTTP response code to expect in –status parameter. It ensures the site is alive and is returning http 200 code.

Besides just warming up a site, you can do some load test on the site. Tinyget can run in multiple threads and run loops to hit some URL. You can literally blow up a site with commands like this:

"%TINYGET%" -threads:30 -loop:100 -srv:google.com -uri:http://www.google.com/ -status:200


Tinyget is also pretty useful to run automated tests. You can record http posts in a text file and then use it to make http posts to some page. Then you can put matching clause to check for certain string in the output to ensure the correct response is given. Thus with some simple command line commands, you can warm up, do some transactions, validate the site is giving off correct response as well as run a load test to ensure the server performing well. Very cheap way to get a lot done.


Simple way to cache objects and collections for greater performance and scalability

Caching of frequently used data greatly increases the
scalability of your application since you can avoid repeated
queries on database, file system or to webservices. When objects
are cached, it can be retrieved from the cache which is lot faster
and more scalable than loading from database, file or web service.
However, implementing caching is tricky and monotonous when you
have to do it for many classes. Your data access layer gets a whole
lot of code that deals with caching objects and collection,
updating cache when objects change or get deleted, expire
collections when a contained object changes or gets deleted and so
on. The more code you write, the more maintenance overhead you add.
Here I will show you how you can make the caching a lot easier
using Linq to SQL and my library AspectF. It’s a
library that helps you get rid of thousands of lines of repeated
code from a medium sized project and eliminates plumbing (logging,
error handling, retrying etc) type code completely.

Here’s an example how caching significantly improves the
performance and scalabitlity of applications. Dropthings – my
open source Web 2.0 AJAX portal, without caching can only serve
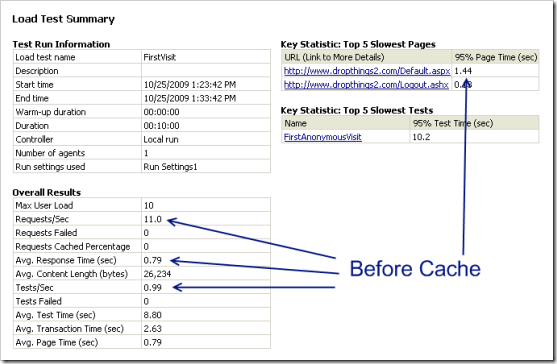
about 11 request/sec with 10 concurrent users on a dual core 64 bit
PC. Here data is loaded from database as well as from external
sources. Avg page response time is 1.44 sec.


Load Test Without Cache

After implementing caching, it became significantly faster,
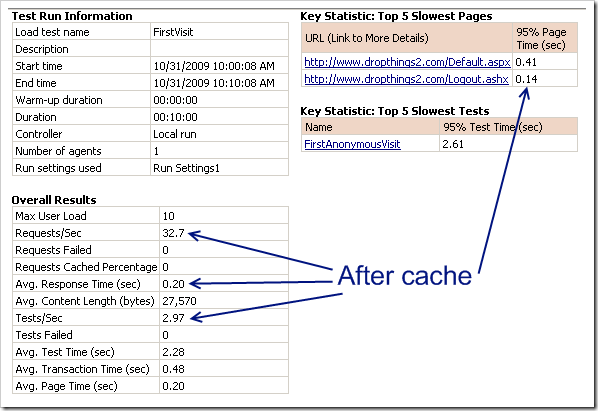
around 32 requests/sec. Page load time decreased
significantly as well to 0.41 sec only. During the
load test, CPU utilization was around 60%.


Load Test with in memory cache

It shows clearly the significant difference it can make to your
application. If you are suffering from poor page load performance
and high CPU or disk activity on your database and application
server, then caching Top 5 most frequently used objects in your
application will solve that problem right away. It’s a quick
win to make your application a lot faster than doing complex
re-engineering in your application.

Common approaches to caching objects and
collections

Sometimes the caching can be simple, for example caching a
single object which does not belong to a collection and does not
have child collections that are cached separately. In such case,
you write simple code like this:

  • Is the object being requested already in cache?
    • Yes, then serve it from cache.
    • No, then load it from database and then cache it.

On the other hand, when you are dealing with cached collection
where each item in the collection is also cached separately, then
the caching logic is not so simple. For example, say you have
cached a User collection. But each User
object is also cached separately because you need to load
individual User objects frequently. Then the caching
logic gets more complicated:

  • Is the collection being requested already in cache?
    • Yes. Get the collection. For each object in the collection:
      • Is that object individually available in cache?
        • Yes, get the individual object from cache. Update it in the
          collection.
        • No, discard the whole collection from cache. Go to next
          step:
    • No. Load the collection from source (eg database) and cache
      each item in the collection separately. Then cache the
      collection.

You might be thinking why do we need to read each individual
item from cache and why do we need to cache each item in collection
separarely when the whole collection is already in cache? There are
two scenarios you need to address when you cache a collection and
individual items in that collection are also cached separately:

  • An individual item has been updated and the updated item is in
    cache. But the collection, which contains all those individual
    items, has not been refreshed. So, if you get the collection from
    cache and return as it is, you will get stale individual items
    inside that collection. This is why each item needs to be retrieved
    from cache separately.
  • An item in the collection may have been force expired in cache.
    For ex, something changed in the object or the object has been
    deleted. So, you expired it in cache so that on next retrieval it
    comes from database. If you load the collection from cache only,
    then the collection will contain the stale object.

If you are doing it the conventional way, you will be writing a
lot of repeated code in your data access layer. For example, say
you are loading a Page collection that belongs to a
user. If you want to cache the collection of Page for
a user as well as cache individual Page objects so
that each Page can be retrieved from Cache directly.
Then you need to write code like this:

public List<Page> GetPagesOfUserOldSchool(Guid userGuid)
{
    ICache cache = Services.Get<ICache>();
    bool isCacheStale = false;
    string cacheKey = CacheSetup.CacheKeys.PagesOfUser(userGuid);
    var cachedPages = cache.Get(cacheKey) as List<Page>;
    if (cachedPages != null)
    {
        var resultantPages = new List<Page>();
        // If each item in the collection is no longer in cache, invalidate the collection
        // and load again.
        foreach (Page cachedPage in cachedPages)
        {
            var individualPageInCache = cache.Get(CacheSetup.CacheKeys.PageId(cachedPage.ID)) as Page;
            if (null == individualPageInCache)
            {
                // Some item is missing in cache. So, the collection is stale.
                isCacheStale = true;
            }
            else
            {
                resultantPages.Add(individualPageInCache);
            }
        }

        cachedPages = resultantPages;
    }

    if (isCacheStale)
    {
        // Collection not cached. Need to load collection from database and then cache it.
        var pagesOfUser = _database.GetList<Page, Guid>(...);
        pagesOfUser.Each(page =>
        {
            page.Detach();
            cache.Add(CacheSetup.CacheKeys.PageId(page.ID), page);
        });
        cache.Add(cacheKey, pagesOfUser);
        return pagesOfUser;
    }
    else
    {
        return cachedPages;
    }
}

Imagine writing this kind of code over and over again for each
and every entity that you want to cache. This becomes a maintenace
nightmare as your project grows.

Here’s how you could do it using AspectF:

public List<Page> GetPagesOfUser(Guid userGuid)
{
    return AspectF.Define
        .CacheList<Page, List<Page>>(Services.Get<ICache>(), 
CacheSetup.CacheKeys.PagesOfUser(userGuid),
page => CacheSetup.CacheKeys.PageId(page.ID)) .Return<List<Page>>(() => _database.GetList<Page, Guid>(...).Select(p => p.Detach()).ToList()); }

Instead of 42 lines of code, you can do it in 5 lines!

Read my article Simple
way to cache objects and collections for greater performance and
scalability
on CodeProject and learn:

  • Caching Linq to SQL entities
  • Handling update and delete scenarios
  • Expiring dependent objects and collections in cache
  • Handling objects that’s cached with multiple keys
  • Avoid database query optimizations when you cache sets of
    data

Enjoy. Don’t forget to vote for me!

7 tips for for loading Javascript rich Web 2.0-like sites significantly faster

Introduction

When you create rich Ajax application, you use external
JavaScript frameworks and you have your own homemade code that
drives your application. The problem with well known JavaScript
framework is, they offer rich set of features which are not always
necessary in its entirety. You may end up using only 30% of jQuery
but you still download the full jQuery framework. So, you are
downloading 70% unnecessary scripts. Similarly, you might have
written your own javascripts which are not always used. There might
be features which are not used when the site loads
for the first time, resulting in unnecessary download during
initial load. Initial loading time is crucial – it can make
or break your website. We did some analysis and found that every
500ms we added to initial loading, we lost approx 30% traffic who
never wait for the whole page to load and just close browser or go
away. So, saving initial loading time, even by couple of hundred
milliseconds, is crucial for survival of a startup, especially if
it’s a Rich AJAX website.

You must have noticed Microsoft’s new tool Doloto
which helps solve the following problem:

Modern Web 2.0 applications, such as GMail, Live Maps, Facebook
and many others, use a combination of Dynamic HTML, JavaScript and
other Web browser technologies commonly referred as AJAX to push
page generation and content manipulation to the client web browser.
This improves the responsiveness of these network-bound
applications, but the shift of application execution from a
back-end server to the client also often dramatically increases the
amount of code that must first be downloaded to the browser. This
creates an unfortunate Catch-22: to create responsive distributed
Web 2.0 applications developers move code to the client, but for an
application to be responsive, the code must first be transferred
there, which takes time.

Microsoft Research looked at this problem and published
this
research paper in 2008
, where they showed how much improvement
can be achieved on initial loading if there was a way to split the
javascripts frameworks into two parts – one primary part
which is absolutely essential for initial rendering of the page and
one auxiliary part which is not essential for initial load and can
be downloaded later or on-demand when user does some action. They
looked at my earlier startup Pageflakes and reported:

2.2.2 Dynamic Loading: Pageflakes
A contrast to Bunny Hunt is the Pageflakes application, an
industrial-strength mashup page providing portal-like
functionality.
While the download size for Pageflakes is over 1 MB, its
initial
execution time appears to be quite fast. Examining network
activity
reveals that Pageflakes downloads only a small stub of code
with the initial page, and loads the rest of its code dynamically
in
the background. As illustrated by Pageflakes, developers today
can
use dynamic code loading to improve their web application’s
performance.
However, designing an application architecture that is
amenable to dynamic code loading requires careful consideration
of JavaScript language issues such as function closures,
scoping,
etc. Moreover, an optimal decomposition of code into
dynamically
loaded components often requires developers to set aside the
semantic
groupings of code and instead primarily consider the execution
order of functions. Of course, evolving code and changing
user workloads make both of these issues a software maintenance
nightmare.

Back in 2007, I was looking at ways to improve the initial load
time and reduce user dropout. The number of users who would not
wait for the page to load and go away was growing day by day as we
introduced new and cool features. It was a surprise. We thought new
features will keep more users on our site but the opposite
happened. Analysis concluded it was the initial loading time that
caused more dropout than it retained users. So, all our hard work
was essentially going to drain and we had to come up with something
ground breaking to solve the problem. Of course we had already
tried all the basic stuffs –
IIS compression
,
browser caching
, on-demand loading of JavaScript,
css and html
when user does something, deferred
JavaScript execution
– but nothing helped. The frameworks
and our own hand coded framework was just too large. So, the idea
tricked me, what if we could load functions inside a class in two
steps. First step will load the class with absolutely essential
functions and second step will inject more functions to the
existing classes.

I published a codeproject article which shows you 7 tricks to
significantly improve page load time even if you have large amount
of Javascript used on the page.

7
Tips for Loading JavaScript Rich Web 2.0-like Sites Significantly
Faster

  1. Use Doloto
  2. Split a Class into Multiple JavaScript Files
  3. Stub the Functions Which Aren’t Called During Initial Load
  4. JavaScript Code in Text
  5. Break UI Loading into Multiple Stages
  6. Always Grow Content from Top to Bottom, Never Shrink or
    Jump
  7. Deliver Browser Specific Script from Server

If you like these tricks, please vote for me!

Memory Leak with delegates and workflow foundation

Recently after Load Testing my open source project Dropthings, I
encountered a lot of memory leak. I found lots of Workflow
Instances and Linq Entities were left in memory and never
collected. After profiling the web application using .NET Memory Profiler, it showed the real picture:


image

It shows you that instances of the several types are being
created but not being removed. You see the “New” column
has positive value, but the “Remove” column has 0. That
means new instances are being created, but not removed. Basically
the way you do Memory Profiling is, you take two snapshots. Say you
take one snapshot when you first visit your website. Then you do
some action on the website that results in allocation of objects.
Then you take another snapshot. When you compare both snapshots,
you can see how many instances of classes were created between
these two snapshots and how many were removed. If they are not
equal, then you have leak. Generally in web application many
objects are created on every page hit and the end of the request,
all those objects are supposed to be released. If they are not
released, then we have a problem. But that’s the scenario for
desktop applications because in a desktop application, objects can
remain in memory until app is closed. But you should know best from
the code which objects were supposed to go out of scope and get
released.

For beginners, leak means objects are being allocated but not
being freed because someone is holding reference to the objects.
When objects leak, they remain in memory forever, until the process
(or app domain) is closed. So, if you have a leaky website, your
website is continuously taking up memory until it runs out of
memory on the web server and thus crash. So, memory leak is a bad
– it prevents you from running your product for long duration
and requires frequent restart of app pool.

So, the above screenshot shows Workflow and Linq related classes
are not being removed, and thus leaking. This means somewhere
workflow instances are not being released and thus all workflow
related objects are remaining. You can see the number is same 48
for all workflow related objects. This is a good indication that,
almost every instance of workflow is leaked because there were
total 48 workflows created and ran. Moreover it indicates we have a
leak from a top Workflow instance level, not in some specific
Activity or somewhere deep in the code.

As the workflows use Linq stuff, they held reference to the Linq
stuffs and thus the Linq stuffs leaked as well. Sometimes you might
be looking for why A is leaking. But you actually end up finding
that since B was holding reference to A and B was leaking and thus
A was leaking as well. This is sometimes tricky to figure out and
you spend a lot of time looking at the wrong direction.

Now let me show you the buggy code:

ManualWorkflowSchedulerService manualScheduler = 
workflowRuntime.GetService<ManualWorkflowSchedulerService>(); WorkflowInstance instance = workflowRuntime.CreateWorkflow(workflowType, properties); instance.Start(); EventHandler<WorkflowCompletedEventArgs> completedHandler = null; completedHandler = delegate(object o, WorkflowCompletedEventArgs e) { if (e.WorkflowInstance.InstanceId == instance.InstanceId) // 1. instance { workflowRuntime.WorkflowCompleted -= completedHandler; // 2. terminatedhandler // copy the output parameters in the specified properties dictionary Dictionary<string,object>.Enumerator enumerator =
e.OutputParameters.GetEnumerator(); while( enumerator.MoveNext() ) { KeyValuePair<string,object> pair = enumerator.Current; if( properties.ContainsKey(pair.Key) ) { properties[pair.Key] = pair.Value; } } } }; Exception x = null; EventHandler<WorkflowTerminatedEventArgs> terminatedHandler = null; terminatedHandler = delegate(object o, WorkflowTerminatedEventArgs e) { if (e.WorkflowInstance.InstanceId == instance.InstanceId) // 3. instance { workflowRuntime.WorkflowTerminated -= terminatedHandler; // 4. completeHandler Debug.WriteLine( e.Exception ); x = e.Exception; } }; workflowRuntime.WorkflowCompleted += completedHandler; workflowRuntime.WorkflowTerminated += terminatedHandler; manualScheduler.RunWorkflow(instance.InstanceId);

Can you spot the code where it leaked?

I have numbered the lines in comment where the leak is
happening. Here the delegate is acting like a closure
and those who are from Javascript background know closure is evil.
They leak memory unless very carefully written. Here the
delegate keeps a reference to the
instance object. So, if somehow delegate
is not released, the instance will remain in memory
forever and thus leak. Now can you find a situation when the
delegate will not be released?

Say the workflow completed. It will fire the completeHandler. But the
completeHandler will not release the
terminateHandler. Thus the
terminateHandler remains in memory and it also holds
reference to the instance. So, we have a leaky
delegate leaking whatever it is holding onto outside
it’s scope. Here the only thing outside the scope if the
instance, which it is tried to access from the parent
function.

Since the workflow instance is not released, all the properties
the workflow and all the activities inside it are holding onto
remains in memory. Most of the workflows and activities expose
public properties which are Linq Entities. Thus the Linq Entities
remain in memory. Now Linq Entities keep a reference to the
DataContext from where it is produced. Thus we have
DataContext remaining in memory. Moreover,
DataContext keeps reference to many internal objects
and metadata cacahe, so they remain in memory as well.

So, the correct code is:

ManualWorkflowSchedulerService manualScheduler = 
workflowRuntime.GetService<ManualWorkflowSchedulerService>(); WorkflowInstance instance = workflowRuntime.CreateWorkflow(workflowType, properties); instance.Start(); var instanceId = instance.InstanceId; EventHandler<WorkflowCompletedEventArgs> completedHandler = null; completedHandler = delegate(object o, WorkflowCompletedEventArgs e) { if (e.WorkflowInstance.InstanceId == instanceId) // 1. instanceId is a Guid { // copy the output parameters in the specified properties dictionary Dictionary<string,object>.Enumerator enumerator =
e.OutputParameters.GetEnumerator(); while( enumerator.MoveNext() ) { KeyValuePair<string,object> pair = enumerator.Current; if( properties.ContainsKey(pair.Key) ) { properties[pair.Key] = pair.Value; } } } }; Exception x = null; EventHandler<WorkflowTerminatedEventArgs> terminatedHandler = null; terminatedHandler = delegate(object o, WorkflowTerminatedEventArgs e) { if (e.WorkflowInstance.InstanceId == instanceId) // 2. instanceId is a Guid { x = e.Exception; Debug.WriteLine(e.Exception); } }; workflowRuntime.WorkflowCompleted += completedHandler; workflowRuntime.WorkflowTerminated += terminatedHandler; manualScheduler.RunWorkflow(instance.InstanceId); // 3. Both delegates are now released
workflowRuntime.WorkflowTerminated -= terminatedHandler; workflowRuntime.WorkflowCompleted -= completedHandler;

There are two changes – in both delegates, the
instanceId variable is passed, instead of the
instance. Since instanceId is a Guid,
which is a struct type data type, not a class, there’s no
issue of referencing. Structs are copied, not referenced. So, they
don’t leak memory. Secondly, both delegates are
released at the end of the workflow execution, thus releasing both
references.

In Dropthings, I am using the famous CallWorkflow Activity by John Flanders, which
is widely used to execute one Workflow from another synchronously.
There’s a CallWorkflowService class which is
responsible for synchronously executing another workflow and that
has similar memory leak problem. The original code of the service
is as following:

public class CallWorkflowService : WorkflowRuntimeService
{
    #region Methods

    public void StartWorkflow(Type workflowType,Dictionary<string,object> inparms, 
Guid caller,IComparable qn) { WorkflowRuntime wr = this.Runtime; WorkflowInstance wi = wr.CreateWorkflow(workflowType,inparms); wi.Start(); ManualWorkflowSchedulerService ss =
wr.GetService<ManualWorkflowSchedulerService>(); if (ss != null) ss.RunWorkflow(wi.InstanceId); EventHandler<WorkflowCompletedEventArgs> d = null; d = delegate(object o, WorkflowCompletedEventArgs e) { if (e.WorkflowInstance.InstanceId ==wi.InstanceId) { wr.WorkflowCompleted -= d; WorkflowInstance c = wr.GetWorkflow(caller); c.EnqueueItem(qn, e.OutputParameters, null, null); } }; EventHandler<WorkflowTerminatedEventArgs> te = null; te = delegate(object o, WorkflowTerminatedEventArgs e) { if (e.WorkflowInstance.InstanceId == wi.InstanceId) { wr.WorkflowTerminated -= te; WorkflowInstance c = wr.GetWorkflow(caller); c.EnqueueItem(qn, new Exception("Called Workflow Terminated",
e.Exception), null, null); } }; wr.WorkflowCompleted += d; wr.WorkflowTerminated += te; } #endregion Methods }

As you see, it has that same delegate holding reference to
instance object problem. Moreover, there’s some queue stuff
there, which requires the caller and qn
parameter passed to the StartWorkflow function. So,
not a straight forward fix.

I tried to rewrite the whole CallWorkflowService so
that it does not require two delegates to be created per Workflow.
Then I took the delegates out. Thus there’s no chance of
closure holding reference to unwanted objects. The result looks
like this:

public class CallWorkflowService : WorkflowRuntimeService
{
    #region Fields

    private EventHandler<WorkflowCompletedEventArgs> _CompletedHandler = null;
    private EventHandler<WorkflowTerminatedEventArgs> _TerminatedHandler = null;
    private Dictionary<Guid, WorkflowInfo> _WorkflowQueue = 
new Dictionary<Guid, WorkflowInfo>(); #endregion Fields #region Methods public void StartWorkflow(Type workflowType,Dictionary<string,object> inparms,
Guid caller,IComparable qn) { WorkflowRuntime wr = this.Runtime; WorkflowInstance wi = wr.CreateWorkflow(workflowType,inparms); wi.Start(); var instanceId = wi.InstanceId; _WorkflowQueue[instanceId] = new WorkflowInfo { Caller = caller, qn = qn }; ManualWorkflowSchedulerService ss =
wr.GetService<ManualWorkflowSchedulerService>(); if (ss != null) ss.RunWorkflow(wi.InstanceId); } protected override void OnStarted() { base.OnStarted(); if (null == _CompletedHandler) { _CompletedHandler = delegate(object o, WorkflowCompletedEventArgs e) { var instanceId = e.WorkflowInstance.InstanceId; if (_WorkflowQueue.ContainsKey(instanceId)) { WorkflowInfo wf = _WorkflowQueue[instanceId]; WorkflowInstance c = this.Runtime.GetWorkflow(wf.Caller); c.EnqueueItem(wf.qn, e.OutputParameters, null, null); _WorkflowQueue.Remove(instanceId); } }; this.Runtime.WorkflowCompleted += _CompletedHandler; } if (null == _TerminatedHandler) { _TerminatedHandler = delegate(object o, WorkflowTerminatedEventArgs e) { var instanceId = e.WorkflowInstance.InstanceId; if (_WorkflowQueue.ContainsKey(instanceId)) { WorkflowInfo wf = _WorkflowQueue[instanceId]; WorkflowInstance c = this.Runtime.GetWorkflow(wf.Caller); c.EnqueueItem(wf.qn,
new Exception("Called Workflow Terminated", e.Exception),
null, null); _WorkflowQueue.Remove(instanceId); } }; this.Runtime.WorkflowTerminated += _TerminatedHandler; } } protected override void OnStopped() { _WorkflowQueue.Clear(); base.OnStopped(); } #endregion Methods #region Nested Types private struct WorkflowInfo { #region Fields public Guid Caller; public IComparable qn; #endregion Fields } #endregion Nested Types }

After fixing the problem, another Memory Profile result showed
the leak is gone:


image

As you see, the numbers vary, which means there’s no
consistent leak. Moreover, looking at the types that remains in
memory, they look more like metadata than instances of
classes. So, they are basically cached instances of metadata,
not instances allocated during workflow execution which are
supposed to be freed. So, we solved the memory leak!

Now you know how to write anonymous delegates without leaking
memory and how to run workflow without leaking them. Basically, the
principle theory is – if you are referencing some outside
object from an anonymous delegate, make sure that
object is not holding reference to the delegate in
some way, may be directly or may be via some child objects of its
own. Because then you have a circular reference. If possible, do
not try to access objects e.g. instance inside an
anonymous delegate that is declared outside the delegate. Try
accessing instrinsic data types like int, string, DateTime, Guid
etc which are not reference type variables. So, instead of
referencing to an object, you should declare local variables e.g.
instanceId that gets the value of properties (e.g.
instance.InstanceId) from the object and then use
those local variables inside the anonymous delegate.
Optimize ASP.NET Membership Stored Procedures for greater speed and scalability

Last year at Pageflakes,
when we were getting millions of hits per day, we were having query
timeout due to lock timeout and Transaction Deadlock errors. These
locks were produced from aspnet_Users and
aspnet_Membership tables. Since both of these tables
are very high read (almost every request causes a read on these
tables) and high write (every anonymous visit creates a row on
aspnet_Users), there were just way too many locks
created on these tables per second. SQL Counters showed thousands
of locks per second being created. Moreover, we had queries that
would select thousands of rows from these tables frequently and
thus produced more locks for longer period, forcing other queries
to timeout and thus throw errors on the website.

If you have read my last blog post, you know why such locks
happen. Basically every table when it grows up to hold millions of
records and becomes popular goes through this trouble. It’s
just a part of scalability problem that is common to database. But
we rarely take prevention about it in our early design.

The solution is simple, you should either have WITH
(NOLOCK)
or SET TRANSACTION ISOLATION LEVEL READ
UNCOMMITTED
before SELECT queries. Either of this will do.
They tell SQL Server not to hold any lock on the table while it is
reading the table. If some row is locked while the read is
happening, it will just ignore that row. When you are reading a
table thousand times per second, without these options, you are
issuing lock on many places around the table thousand times per
second. It not only makes read from table slower, but also so many
lock prevents insert, update, delete from happening timely and thus
queries timeout. If you have queries like “show the currently
online users from last one hour based on
LastActivityDate field”, that is going to issue
such a wide lock that even other harmless select queries will
timeout. And did I tell you that there’s no index on
LastActivityDate on aspnet_Users
table?

Now don’t blame yourself for not putting either of these
options on your every stored proc and every dynamically generated
SQL from the very first day. ASP.NET developers made the same
mistake. You won’t see either of these used in any of the
stored procs used by ASP.NET Membership. For example, the following
stored proc gets called whenever you access Profile
object:

ALTER PROCEDURE [dbo].[aspnet_Profile_GetProperties]
@ApplicationName
nvarchar(256),
@UserName nvarchar(256),
@CurrentTimeUtc datetime
AS
BEGIN

DECLARE
@ApplicationId uniqueidentifier
SELECT
@ApplicationId = NULL
SELECT
@ApplicationId = ApplicationId FROM
dbo.aspnet_Applications WHERE LOWER(@ApplicationName) = LoweredApplicationName
IF (@ApplicationId IS NULL)
RETURN

DECLARE
@UserId uniqueidentifier
DECLARE
@LastActivityDate datetime
SELECT
@UserId = NULL

SELECT
@UserId = UserId, @LastActivityDate = LastActivityDate
FROM dbo.aspnet_Users
WHERE ApplicationId = @ApplicationId AND LoweredUserName = LOWER(@UserName)

IF (@UserId IS NULL)
RETURN
SELECT TOP
1 PropertyNames, PropertyValuesString, PropertyValuesBinary
FROM dbo.aspnet_Profile
WHERE UserId = @UserId

IF (@@ROWCOUNT > 0)
BEGIN
UPDATE
dbo.aspnet_Users
SET LastActivityDate=@CurrentTimeUtc
WHERE UserId = @UserId
END
END

There are two
SELECT operations that hold lock on two very high read tables
aspnet_Users and aspnet_Profile.
Moreover, there’s a nasty UPDATE statement. It tries to
update the LastActivityDate of a user whenever you
access Profile object for the first time within a http
request.

This stored proc alone is enough to bring your site down. It did
to us because we are using Profile Provider
everywhere. This stored proc was called around 300 times/sec. We
were having nightmarish slow performance on the website and many
lock timeouts and transaction deadlocks. So, we added the
transaction isolation level and we also modified the UPDATE
statement to only perform an update when the
LastActivityDate is over an hour. So, this means, the
same user’s LastActivityDate won’t be
updated if the user hits the site within the same hour.

So, after the modifications, the stored proc looked like
this:

ALTER PROCEDURE [dbo].[aspnet_Profile_GetProperties]
@ApplicationName
nvarchar(256),
@UserName nvarchar(256),
@CurrentTimeUtc datetime
AS
BEGIN
-- 1. Please no more locks during reads
SET TRANSACTION ISOLATION LEVEL READ UNCOMMITTED;

DECLARE @ApplicationId uniqueidentifier
--SELECT @ApplicationId = NULL
--SELECT @ApplicationId = ApplicationId FROM dbo.aspnet_Applications
WHERE LOWER(@ApplicationName) = LoweredApplicationName
--IF (@ApplicationId IS NULL)
-- RETURN

-- 2. No more call to Application table. We have only one app dude!
SET @ApplicationId = dbo.udfGetAppId()

DECLARE @UserId uniqueidentifier
DECLARE
@LastActivityDate datetime
SELECT
@UserId = NULL

SELECT
@UserId = UserId, @LastActivityDate = LastActivityDate
FROM dbo.aspnet_Users
WHERE ApplicationId = @ApplicationId AND LoweredUserName = LOWER(@UserName)

IF (@UserId IS NULL)
RETURN
SELECT TOP
1 PropertyNames, PropertyValuesString, PropertyValuesBinary
FROM dbo.aspnet_Profile
WHERE UserId = @UserId

IF (@@ROWCOUNT > 0)
BEGIN
-- 3. Do not update the same user within an hour
IF DateDiff(n, @LastActivityDate, @CurrentTimeUtc) > 60
BEGIN
-- 4. Use ROWLOCK to lock only a row since we know this query
-- is highly selective
UPDATE dbo.aspnet_Users WITH(ROWLOCK)
SET LastActivityDate=@CurrentTimeUtc
WHERE UserId = @UserId
END
END
END

The changes I
made are numbered and commented. No need for further explanation.
The only tricky thing here is, I have eliminate call to Application
table just to get the ApplicationID from ApplicationName. Since
there’s only one application in a database (ever heard of
multiple applications storing their user separately on the same
database and the same table?), we don’t need to look up the
ApplicationID on every call to every Membership stored proc. We can
just get the ID and hard code it in a function.

CREATE FUNCTION dbo.udfGetAppId()
RETURNS uniqueidentifier
WITH EXECUTE AS
CALLER
AS
BEGIN
RETURN CONVERT
(uniqueidentifier, 'fd639154-299a-4a9d-b273-69dc28eb6388')
END;

This UDF returns the ApplicationID that I have
hardcoded copying from the Application table. Thus it eliminates
the need for quering on the Application table.

Similarly you should do the changes in all other stored
procedures that belong to Membership Provider. All the stroc procs
are missing proper locking, issues aggressive lock during update
and too frequent updates than practical need. Most of them also try
to resolve ApplicationID from ApplicationName, which is unnecessary
when you have only one web application per database. Make these
changes and enjoy lock contention free super performance from
Membership Provider!


kick it on DotNetKicks.com

Linq to SQL solve Transaction deadlock and Query timeout problem using uncommitted reads

When your database tables start accumulating thousands of rows
and many users start working on the same table concurrently, SELECT
queries on the tables start producing lock contentions and
transaction deadlocks. This is a common problem in any high volume
website. As soon as you start getting several concurrent users
hitting your website that results in SELECT queries on some large
table like aspnet_users table that are also being updated
very frequently, you end up having one of these errors:

Transaction (Process ID ##) was deadlocked on lock resources
with another process and has been chosen as the deadlock victim.
Rerun the transaction.

Or,

Timeout Expired. The Timeout Period Elapsed Prior To Completion
Of The Operation Or The Server Is Not Responding.

The solution to these problems are – use proper index on
the table and use transaction isolation level Read
Uncommitted
or WITH (NOLOCK) in your SELECT queries. So,
if you had a query like this:

SELECT * FORM aspnet_users
where ApplicationID =’xxx’ AND LoweredUserName = 'someuser'

You should end up having any of the above errors under high
load. There are two ways to solve this:

SET TRANSACTION LEVEL READ UNCOMMITTED;
SELECT * FROM aspnet_Users
WHERE ApplicationID =’xxx’ AND LoweredUserName = 'someuser'

Or use the WITH (NOLOCK):

SELECT * FROM aspnet_Users WITH (NOLOCK)
WHERE ApplicationID =’xxx’ AND LoweredUserName = 'someuser'

The reason for the errors are that since aspnet_users is
a high read and high write table, during read, the table is
partially locked and during write, it is also locked. So, when the
locks overlap on each other from several queries and especially
when there’s a query that’s trying to read a large
number of rows and thus locking large number of rows, some of the
queries either timeout or produce deadlocks.

Linq to Sql does not produce queries with the WITH
(NOLOCK)
option nor does it use READ UNCOMMITTED. So, if
you are using Linq to SQL queries, you are going to end up with any
of these problems on production pretty soon when your site becomes
highly popular.

For example, here’s a very simple query:

using (var db = new DropthingsDataContext()) { var user = db.aspnet_Users.First(); var pages = user.Pages.ToList(); }

DropthingsDataContext is a DataContext built from Dropthings database.

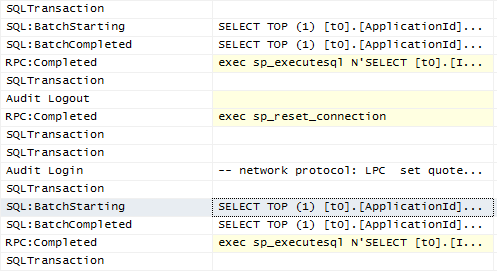
When you attach SQL Profiler, you get this:

You see none of the queries have READ UNCOMMITTED or WITH

(NOLOCK).

The fix is to do this:

using (var db = new DropthingsDataContext2()) { db.Connection.Open(); db.ExecuteCommand("SET TRANSACTION ISOLATION LEVEL READ UNCOMMITTED;"); var user = db.aspnet_Users.First(); var pages = user.Pages.ToList(); }

This will result in the following profiler output

As you see, both queries execute within the same connection and
the isolation level is set before the queries execute. So, both
queries enjoy the isolation level.

Now there’s a catch, the connection does not close. This
seems to be a bug in the DataContext that when it is disposed, it
does not dispose the connection it is holding onto.

In order to solve this, I have made a child class of the
DropthingsDataContext named DropthingsDataContext2
which overrides the Dispose method and closes the
connection.

   class DropthingsDataContext2 : DropthingsDataContext, IDisposable { public new void Dispose() { if (base.Connection != null) if (base.Connection.State != System.Data.ConnectionState.Closed) { base.Connection.Close(); base.Connection.Dispose(); } base.Dispose(); } }

This solved the connection problem.

There you have it, no more transaction deadlock or lock
contention from Linq to SQL queries. But remember, this is only to
eliminate such problems when your database already has the right
indexes. If you do not have the proper index, then you will end up
having lock contention and query timeouts anyway.

There’s one more catch, READ UNCOMMITTED will return rows
from transactions that have not completed yet. So, you might be
reading rows from transactions that will rollback. Since
that’s generally an exceptional scenario, you are more or
less safe with uncommitted read, but not for financial applications
where transaction rollback is a common scenario. In such case, go
for committed read or repeatable read.

There’s another way you can achieve the same, which seems
to work, that is using .NET Transactions. Here’s the code
snippet:

using (var transaction = new TransactionScope( TransactionScopeOption.RequiresNew, new TransactionOptions() { IsolationLevel = IsolationLevel.ReadUncommitted, Timeout = TimeSpan.FromSeconds(30) })) { using (var db = new DropthingsDataContext()) { var user = db.aspnet_Users.First(); var pages = user.Pages.ToList(); transaction.Complete(); } }

Profiler shows a transaction begins and ends:

The downside is it wraps your calls in a transaction. So, you

are unnecessarily creating transactions even for SELECT operations.
When you do this hundred times per second on a web application,
it’s a significant over head.

Some really good examples of deadlocks are given in this
article:

http://www.code-magazine.com/article.aspx?quickid=0309101&page=2

I highly recommend it.


99.99% available ASP.NET and SQL Server SaaS Production Architecture

You have a hot ASP.NET+SQL Server product, growing at thousand
users per day and you have hit the limit of your own garage hosting
capability. Now that you have enough VC money in your pocket, you
are planning to go out and host on some real hosting facility,
maybe a colocation or managed hosting. So, you are thinking, how to
design a physical architecture that will ensure performance,
scalability, security and availability of your product? How can you
achieve four-nine (99.99%) availability? How do you securely let
your development team connect to production servers? How do you
choose the right hardware for web and database server? Should you
use Storage Area Network (SAN) or just local disks on RAID? How do
you securely connect your office computers to production
environment?

Here I will answer all these queries. Let me first show you a
diagram that I made for Pageflakes where we ensured we get
four-nine availability. Since Pageflakes is a Level 3
SaaS
, it’s absolutely important that we build a high
performance, highly available product that can be used from
anywhere in the world 24/7 and end-user gets quick access to their
content with complete personalization and customization of content
and can share it with others and to the world. So, you can take
this production architecture as a very good candidate for Level 3
SaaS:


Hosting_environment

Here’s a CodeProject article that explains all the
ideas:

99.99% available ASP.NET and SQL Server SaaS Production
Architecture

Hope you like it. Appreciate your vote.


kick it on DotNetKicks.com

Linq to SQL: Delete an entity using Primary Key only

Linq to Sql does not come with a function like .Delete(ID) which allows you to
delete an entity using it’s primary key. You have to first
get the object that you want to delete and then call .DeleteOnSubmit(obj) to queue
it for delete. Then you have to call DataContext.SubmitChanges() to
play the delete queries on database. So, how to delete object
without getting them from database and avoid database
roundtrip?


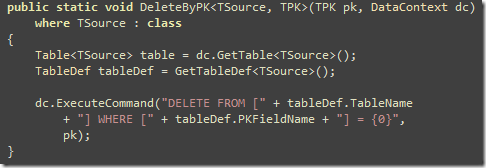
Delete an object without getting it - Linq to Sql

You can call this function using DeleteByPK(10,
dataContext);

First type is the entity type and second one is the type of the
primary key. If your object’s primary key is a Guid field, specify
Guid instead of
int.

How it works:

  • It figures out the table name and the primary key field name
    from the entity
  • Then it uses the table name and primary key field name to build
    a DELETE query

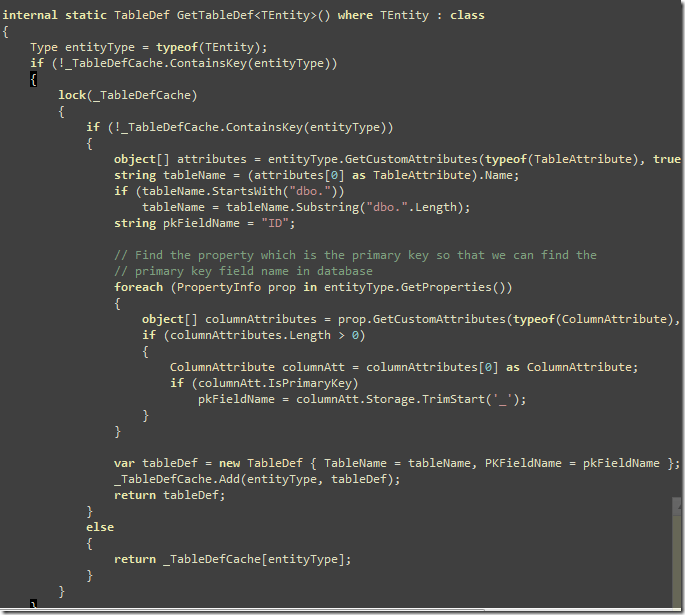
Figuring out the table name and primary key field name is a bit
hard. There’s some reflection involved. The GetTableDef()
returns the table name and primary key field name for an
entity.

Every Linq Entity class is decorated with a Table attribute that has the
table name:


Lint entity declaration

Then the primary key field is decorated with a Column attribute with
IsPrimaryKey =
true
.


Primary Key field has Column attribute with IsPrimaryKey = true

So, using reflection we can figure out the table name and the
primary key property and the field name.

Here’s the code that does it:


Using reflection find the Table attribute and the Column attribute

Before you scream “Reflection is SLOW!!!!” the
definition is cached. So, reflection is used only once per
appDomain per entity. Subsequent call is just a dictionary lookup
away, which is as fast as it can get.

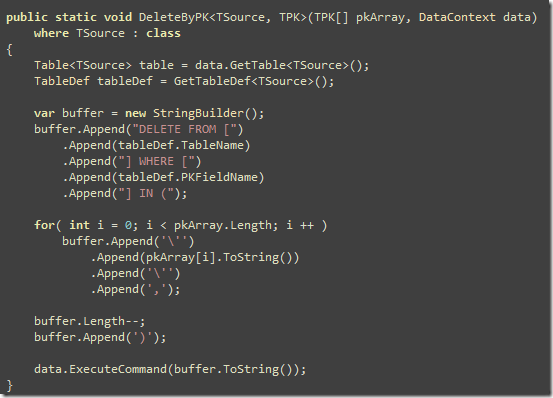
You can also delete a collection of object without ever getting
any one of them. The the following function to delete a whole bunch
of objects:


Delete a list of objects using Linq to SQL

The code is available here:

http://code.msdn.microsoft.com/DeleteEntitiesLinq


kick it on DotNetKicks.com

Solving common problems with Compiled Queries in Linq to Sql for high demand ASP.NET websites

If you are using Linq to SQL, instead of writing regular Linq
Queries, you should be using
Compiled Queries
. if you are building an ASP.NET web
application that’s going to get thousands of hits per hour,
the execution overhead of Linq queries is going to consume too much
CPU and make your site slow. There’s a runtime cost
associated with each and every Linq Query you write. The queries
are parsed and converted to a nice SQL Statement on *every* hit.
It’s not done at compile time because there’s no way to
figure out what you might be sending as the parameters in the
queries during runtime. So, if you have common Linq to Sql
statements like the following one throughout your growing web
application, you are soon going to have scalability nightmares:

var query = from widget in dc.Widgets
where widget.ID == id && widget.PageID == pageId
select widget;

var widget = query.SingleOrDefault();

There’s
a nice blog post by JD Conley
that shows how evil Linq to Sql
queries are:


image

You see how many times SqlVisitor.Visit is called to
convert a Linq Query to its SQL representation? The runtime cost to
convert a Linq query to its SQL Command representation is just way
too high.


Rico Mariani has a very informative performance comparison
of
regular Linq queries vs Compiled Linq queries performance:


image

Compiled Query wins on every case.

So, now you know about the benefits of compiled queries. If you
are building ASP.NET web application that is going to get high
traffic and you have a lot of Linq to Sql queries throughout your
project, you have to go for compiled queries. Compiled Queries are
built for this specific scenario.

In this article, I will show you some steps to convert regular
Linq to Sql queries to their Compiled representation and how to
avoid the dreaded exception “Compiled queries across
DataContexts with different LoadOptions not
supported.”

Here are some step by step instruction on converting a Linq to
Sql query to its compiled form:

First we need to find out all the external decision factors in a
query. It mostly means parameters in the WHERE clause. Say, we are
trying to get a user from aspnet_users table using
Username and Application ID:

Here, we have two external decision factor – one is the
Username and another is the Application ID. So, first think this
way, if you were to wrap this query in a function that will just
return this query as it is, what would you do? You would create a
function that takes the DataContext (dc named here),
then two parameters named userName and applicationID, right?

So, be it. We create one function that returns just this
query:


Converting a LInq Query to a function

Next step is to replace this function with a Func<> representation
that returns the query. This is the hard part. If you haven’t
dealt with Func<> and Lambda
expression before, then I suggest you read this
and
this
and then continue.

So, here’s the delegate representation of the above
function:


Creating a delegate out of Linq Query

Couple of things to note here. I have declared the delegate as
static readonly
because a compiled query is declared only once and reused by all
threads. If you don’t declare Compiled Queries as static,
then you don’t get the performance gain because compiling
queries everytime when needed is even worse than regular Linq
queries.

Then there’s the complex Func> thing. Basically the
generic Func<> is declared to
have three parameters from the GetQuery function and a return
type of IQueryable.
Here the parameter types are specified so that the delegate is
created strongly typed. Func<> allows up to 4
parameters and 1 return type.

Next comes the real business, compiling the query. Now that we
have the query in delegate form, we can pass this to CompiledQuery.Compile function
which compiles the delegate and returns a handle to us. Instead of
directly assigning the lambda expression to the func, we will pass
the expression through the CompiledQuery.Compile
function.


Converting a Linq Query to Compiled Query

Here’s where head starts to spin. This is so hard to read
and maintain. Bear with me. I just wrapped the lambda expression on
the right side inside the CompiledQuery.Compile function.
Basically that’s the only change. Also, when you call
CompiledQuery.Compile<>,
the generic types must match and be in exactly the same order as
the Func<>
declaration.

Fortunately, calling a compiled query is as simple as calling a
function:


Running Compiled Query

There you have it, a lot faster Linq Query execution. The hard
work of converting all your queries into Compiled Query pays off
when you see the performance difference.

Now, there are some challenges to Compiled Queries. Most common
one is, what do you do when you have more than 4 parameters to
supply to a Compiled Query? You can’t declare a Func<> with more than 4
types. Solution is to use a struct to encapsulate all the
parameters. Here’s an example:


Using struct in compiled query as parameter

Calling the query is quite simple:


Calling compiled query with struct parameter

Now to the dreaded challenge of using LoadOptions with Compiled
Query. You will notice that the following code results in an
exception:


Using DataLoadOptions with Compiled Query

The above DataLoadOption runs perfectly
when you use regular Linq Queries. But it does not work with
compiled queries. When you run this code and the query hits the
second time, it produces an exception:

Compiled queries across DataContexts with different
LoadOptions not supported

A compiled query remembers the DataLoadOption once its called.
It does not allow executing the same compiled query with a
different DataLoadOption again. Although
you are creating the same DataLoadOption with the same
LoadWith<>
calls, it still produces exception because it remembers the exact
instance that was used when the compiled query was called for the
first time. Since next call creates a new instance of DataLoadOptions, it does not
match and the exception is thrown. You can read details about the
problem in
this forum post
.

The solution is to use a static DataLoadOption. You cannot
create a local DataLoadOption instance and use
in compiled queries. It needs to be static. Here’s how you
can do it:


image

Basically the idea is to construct a static instance of DataLoadOptions using a static
function. As writing function for every single DataLoadOptions combination is
painful, I created a static delegate here and executed it right on
the declaration line. This is in interesting way to declare a
variable that requires more than one statement to prepare it.

Using this option is very simple:


image

Now you can use DataLoadOptions with compiled
queries.


kick it on DotNetKicks.com