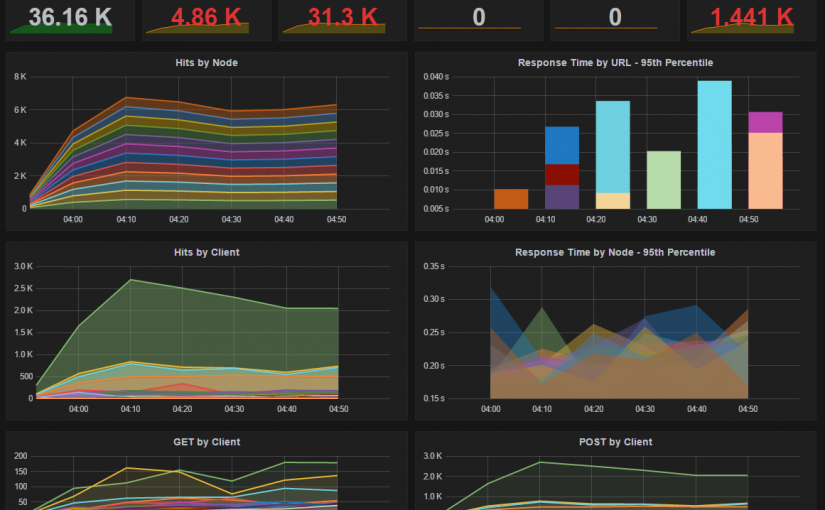
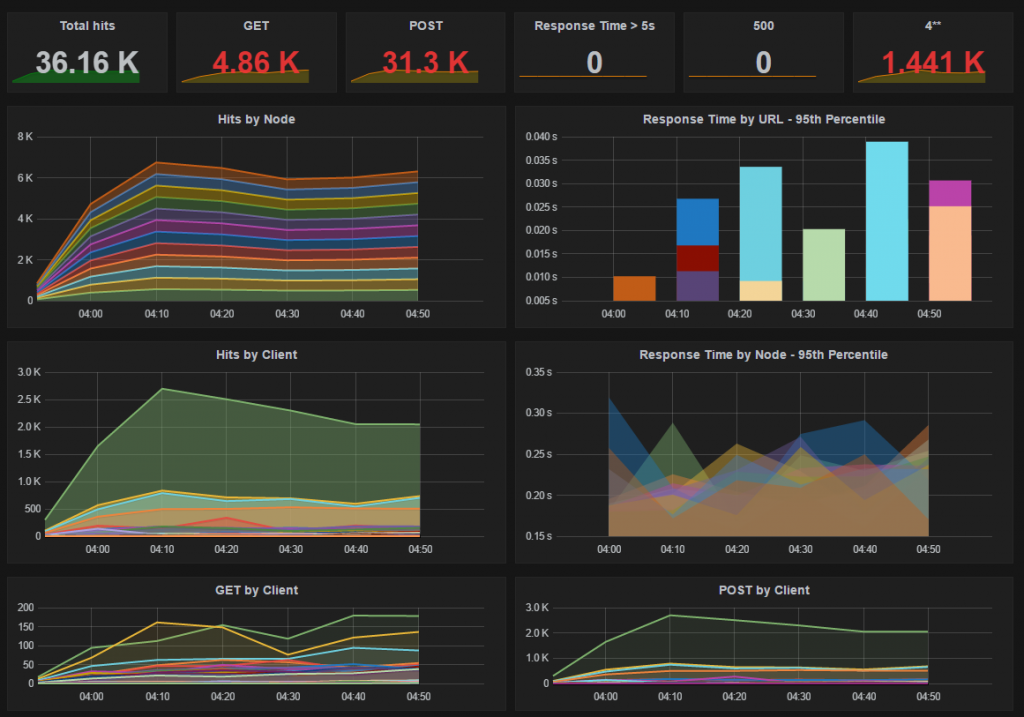
IIS or Apache do not come with any monitoring dashboard that shows you graphs of requests/sec, response times, slow URLs, failed requests and so on. You need to use external tools to visualize that. ElasticSearch and Grafana are two such tools that let you collect logs from web servers, and then parse, filter, sort, analyze, and create beautiful presentations out of them. ElasticSearch is a distributed JSON document store, just like a NoSQL database. You can use it to store logs as JSON documents. Then you can use Grafana to fetch those documents from ElasticSearch and build beautiful presentations. Both are free and open source.
Read the full details here, please don’t forget to rate:
http://www.codeproject.com/Articles/1094405/Powerful-IIS-Apache-Monitoring-dashboard-using
ElasticSearch is a very powerful product. It is a multi-purpose distributed JSON document store and also a powerful search engine. Most frequent use cases for ElasticSearch is to create searchable documents, implement auto completion feature, and also aggregate logs and analyze them. Grafana is a beautiful Dashboard tool that takes ElasticSearch, among many, as a data source. Combing these two, you can build sophisticated monitoring and reporting tools to get a holistic view on how your application is performing and where the issues are.
Enjoy!

